What is Data Visualisation and how it is influencing decision making
Informed decision making has become the foundation of successful businesses. As an informed decision maker for businesses, one needs quick access to highly visual business intelligence to get helped taking quick decisions. As the business grows, the amount the data collected also grows simultaneously. Thus, in case the data is provided in spreadsheets or tabular reports, it will become increasingly challenging to analyse and extract the trends and correlation to complete the task well. Here arrives the need of data visualisation.
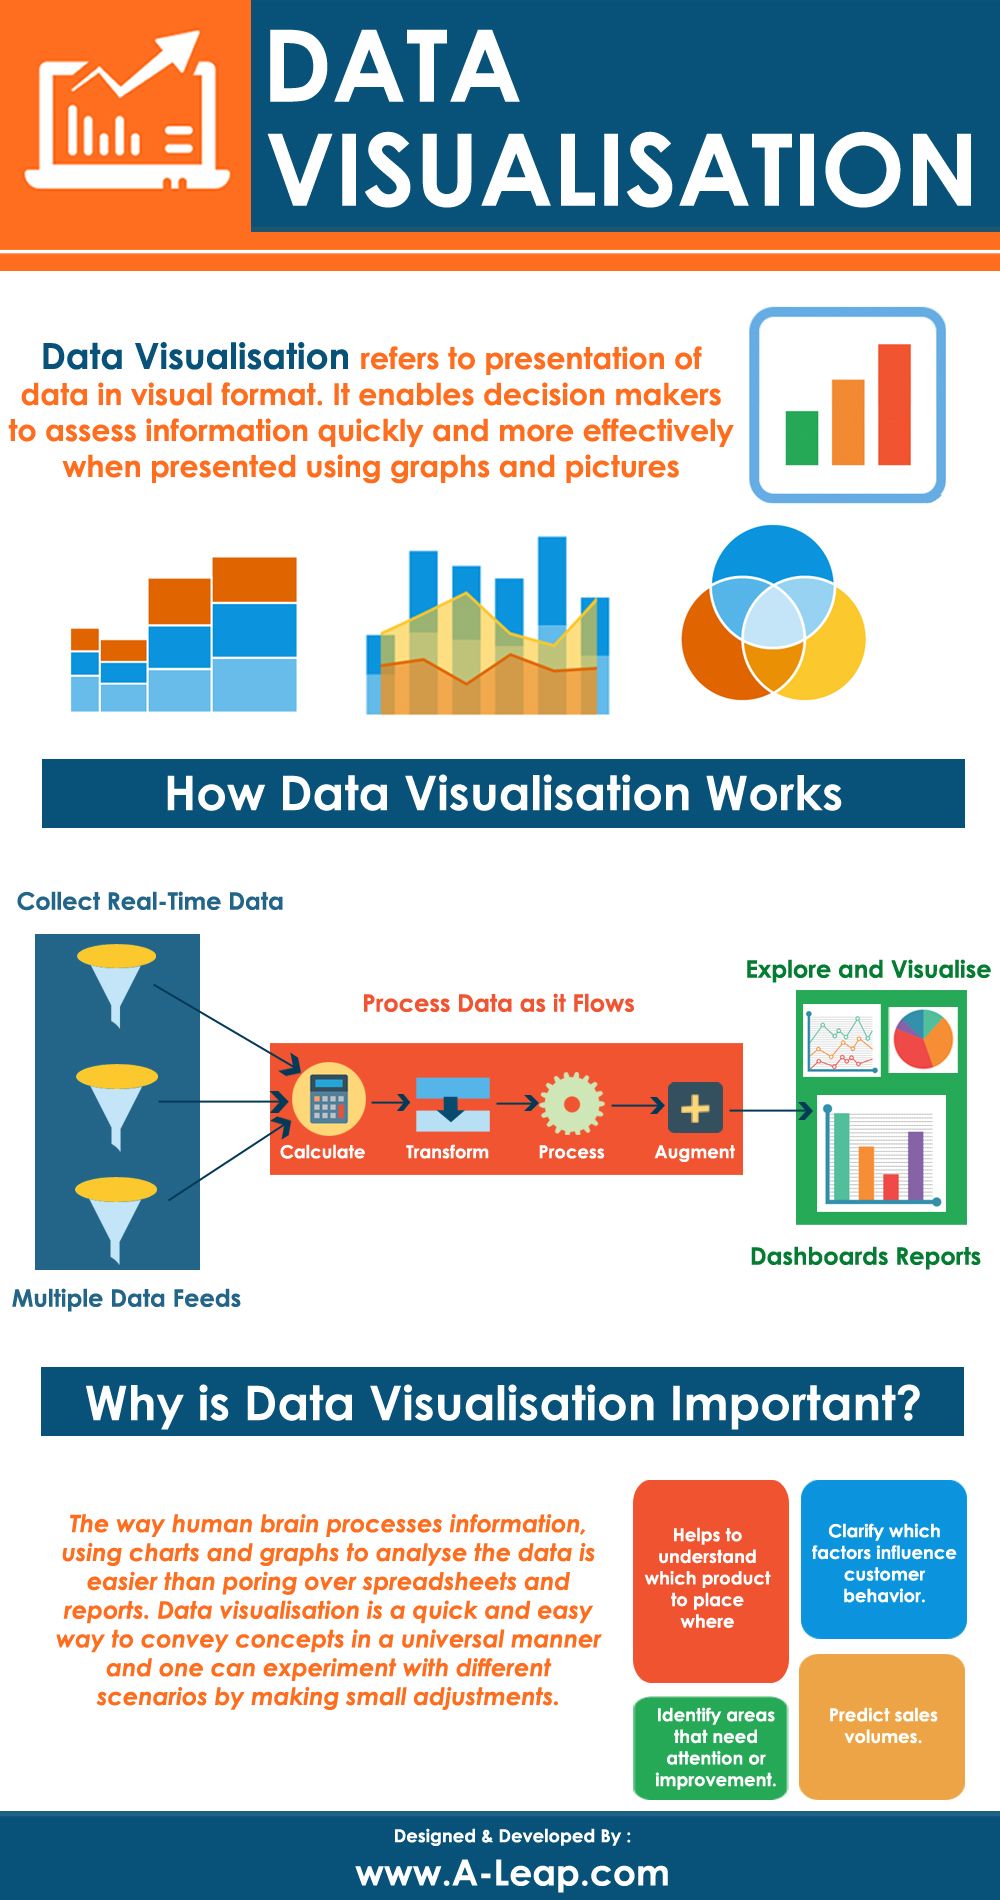
What is data visualisation?
Data visualisation can be defined as the process of data presentation in visual format. For the data analysers, it brings forward an opportunity for the quick assessment of any information by presenting it in graphical or other pictorial formats. The tricky concepts, trends, patterns and correlation that carry the probability of going undetected in the text format may be recognised in a hassle-free way through data visualisation.
In the current time, the boundaries of data visualisation have expanded beyond the usage of standard visual representations available with the Microsoft spreadsheets, such as charts and graphs. Depicting data in a visually appealing way through info-graphics, geographical maps, dials and gauges, heat maps, spark lines along with detailed pie, bar and fever charts is the new trend. The visual depictions consist of interactive capabilities that enable the user to churn out the data for analysis and querying.
Benefits of data visualisation in decision making
Quick conversion of data into meaning information - Providing data as visual representations, the enterprises quickly gain access to a cohesive view of huge amount of data. Owing to the fact that the process of visual information is simple, the challenges faced by enterprises for data processing can be addressed in a comparatively shorter time frame with better decision-making.
Simpler identification of unseen patterns and new relations - Voluminous amounts of data make sense hassle-freely with the addition of visual representations. The overall purpose is the identification of highly correlated parameters which may help the enterprise in better decision-making by focusing on factors that are most influential to their core objectives.
Discovery of new trends - The initiation of new trends in a sector and alongside changing customer behavior can be monitored with data visualisation in order to offer the enterprise an advantage over their competitors. The identification of upcoming challenges and opportunities has the potential to win vulnerable business times in the fast-changing environment.
Spreading the message - Whenever new trend, information or association is explored through a data piece, the next step ought to be the communication of the extracted insights within the business. With the use of data visualization, the insight can be converted into a simply understandable and engaging data piece which is useful to the employees for reaping the same benefits as compared to big data.
However, it is to be noted that the increasing amount of available data (Big Data) has brought forward immense opportunities. It has led the enterprises and even individuals to proclaim its potential for aiding decision-making in order to increase accountability within the development boundaries. Big Data allows people to monitor the outcomes of implemented policies and also to navigate towards better decisions.
Data analysis and its conversion into useful information help making predictions that have the capability to significantly assist growth. Extraction the best course of action, data visualisation allows the user to assure that development is attained through a planned process that bears the maximum potential.
Challenges associated with data processing
While the growing amount of gathered data enhances accountability and could better the overall decision-making process, it is not a simple process to do so. The mere availability of huge amount of data does not ensure that it will be used properly by enterprises for decision making. The data storage capacity has grown exponentially in comparison to the capability of any enterprise or professional to analyse since the year 1986. This very fact indicates that there exist missed opportunities in case of data science.
Data analysis has become the biggest constraint. In today’s world incorporated with the ever-ending process of data production, analysis of data for usable information to support the decision making process is a challenge. In order to ensure proper usage of useful data to extract actionable information, investments are required to be made for analyzing the information and communicating it in a way that is practical and simple to use. This in turn, demands the non-data specialists to investment in mechanisms facilitating the assessment and utilization of data. Owing to the fact that Data visualization supports the assessment, communication and usage of data, enterprises have started relying majorly on it.
While there is an everyday increase in the new innovations facilitating the process of data visualisation, there’s a relative lack in critical assessments carried out around its capability to contribute towards the attainment of certain objectives. In spite of the increasing exposure to visualisation, its success in growth contribution depends on one’s ability to extract the information.
Given the growing data availability today, many enterprises have adopted a stagnant position by incorporating best practices in their work process in order to rehash rather than reinventing the data. The ultimate goal of the data visualisation process and maintenance of real-time performance is to extract every possible insight in order to achieve a success moment and chance the business course for the best. Doing so not only implies the usage of the most appropriate information for creation of an understandable visual but also the incorporation of new sources and innovative ideas for pushing data boundaries instead of reinforcing arbitrary limitations.

Contact us
support@a-leap.com